ELT Pipeline
Architecture Overview
The pipeline follows a standard modern data stack pattern:
NYC Open Data (Socrata API)
        │
        ▼
  Cloud Function (Python)          ← Extract & Load
        │
        ▼
  BigQuery - raw dataset           ← Raw tables (source-faithful)
        │
        ▼
  dbt - staging models             ← Type casting, renaming, light cleaning
        │
        ▼
  dbt - mart models                ← Star schema (facts + dimensions)
        │
        ▼
  BigQuery - group_3_marts         ← Final warehouse
        │
        ▼
  Data Studio (Looker Studio)      ← Visualization & dashboards
Tools Used
| Tool | Purpose |
|---|---|
| Socrata Open Data API | Extracted both source datasets from NYC Open Data |
| Google Cloud Functions (Python) | Server-less extract-and-load scripts that wrote raw data to BigQuery |
| Google BigQuery | Cloud data warehouse → hosts raw, staging, and mart datasets |
| dbt (data build tool) | SQL-based transformation framework; manages staging → mart models with lineage tracking |
| GitHub | Version control for all dbt models, macros, and project config |
| Data Studio (Looker Studio) | BI dashboarding and visualization layer |
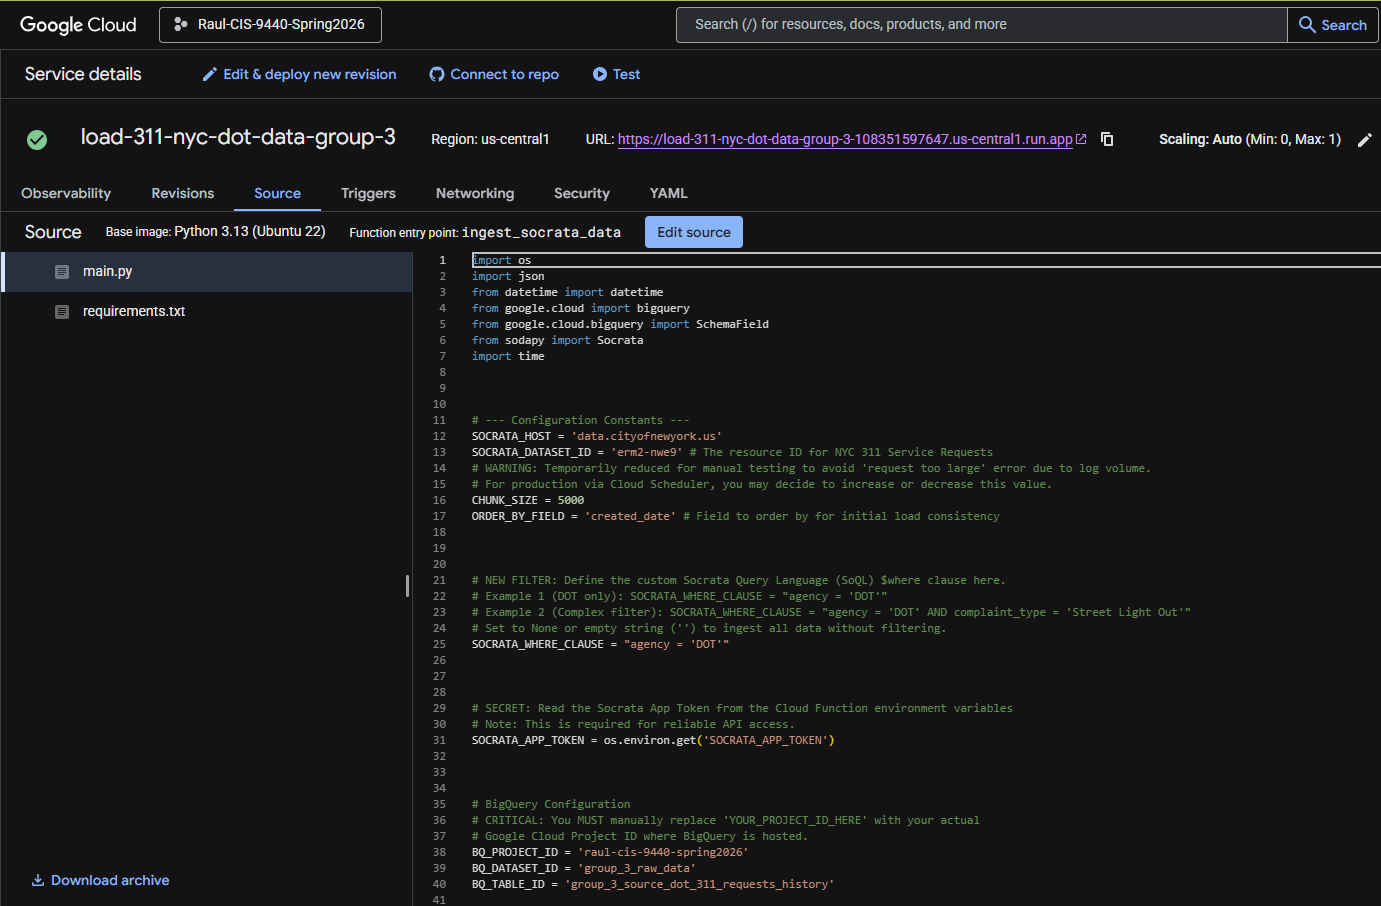
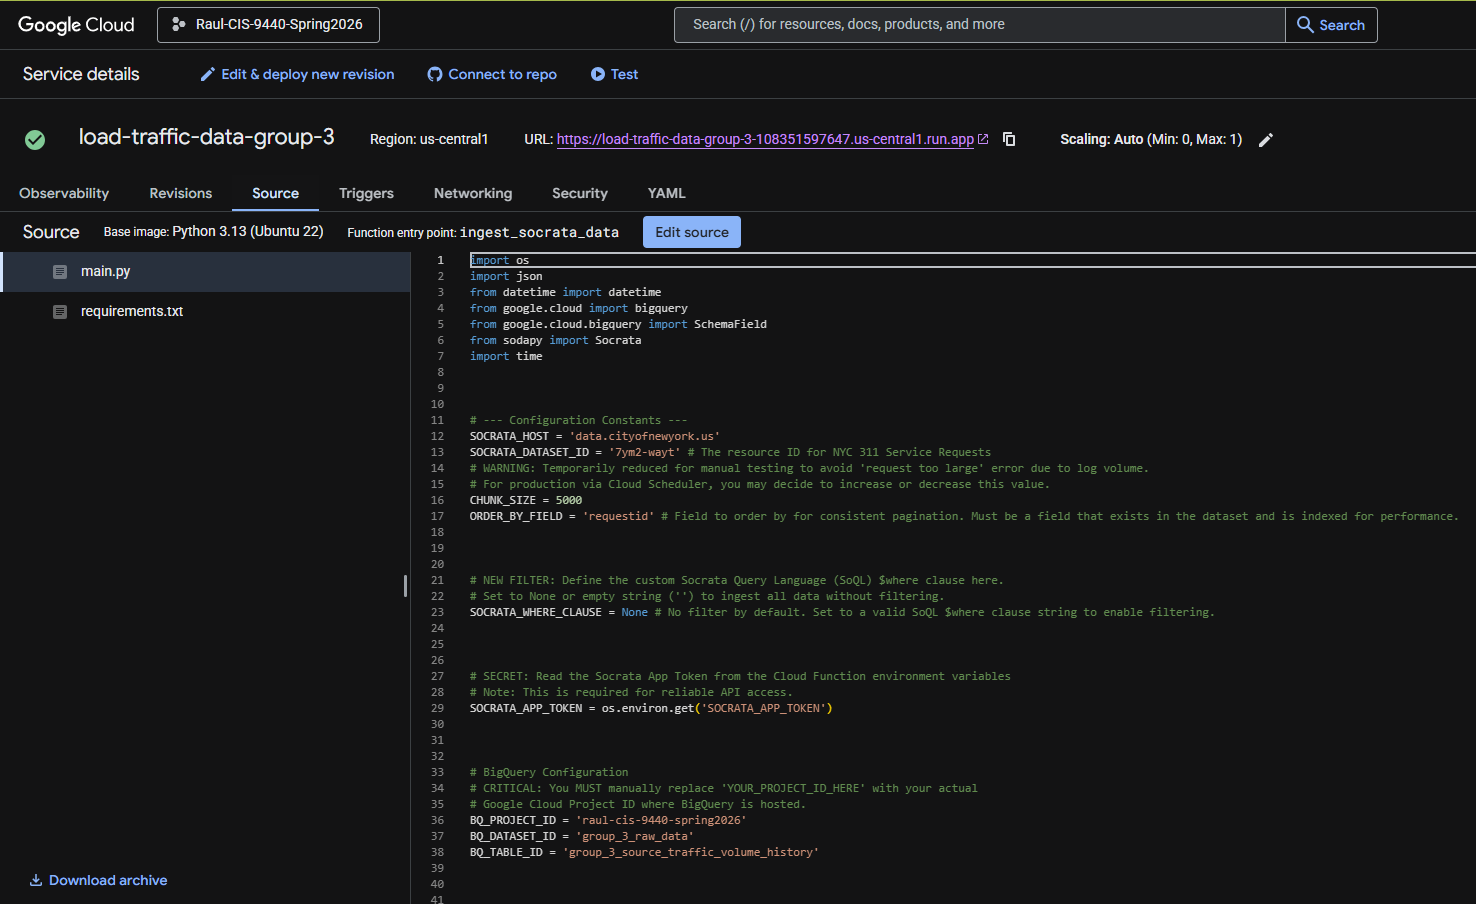
Extract & Load
Cloud Functions
Both data sources were extracted from the NYC Open Data Socrata API using Google Cloud Functions written in Python. Each function authenticated with the API, paginated through results filtered to the 2020-2025 date range, and loaded the raw JSON responses directly into BigQuery.
311 Service Requests
Traffic Volume Counts
Raw Tables in BigQuery
After extraction, two raw tables existed in BigQuery:
| Dataset | Table | Description |
|---|---|---|
group_3_raw |
raw_311_service_requests |
All NYC 311 service requests filtered to street-related complaint types, 2020-2025 |
group_3_raw |
raw_traffic_volume_counts |
DOT automated traffic count records at 15-minute intervals, 2020-2025 |
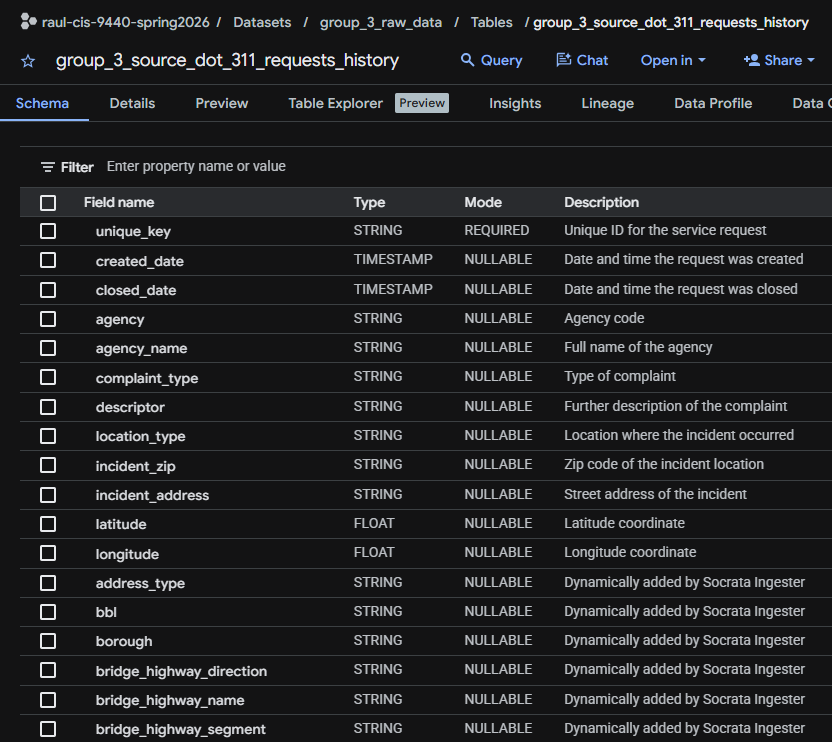
raw_311_service_requests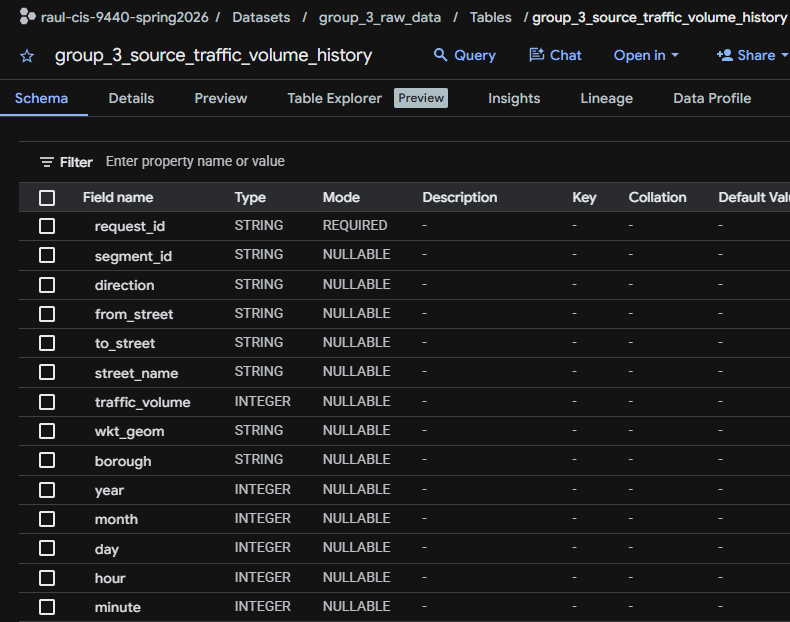
raw_traffic_volume_countsTransform → dbt Models
All transformations were written in dbt SQL and are version-controlled in the project GitHub repository.
DAG Lineage
The dbt DAG lineage graph below shows the full dependency chain from raw sources through staging to the final mart tables.
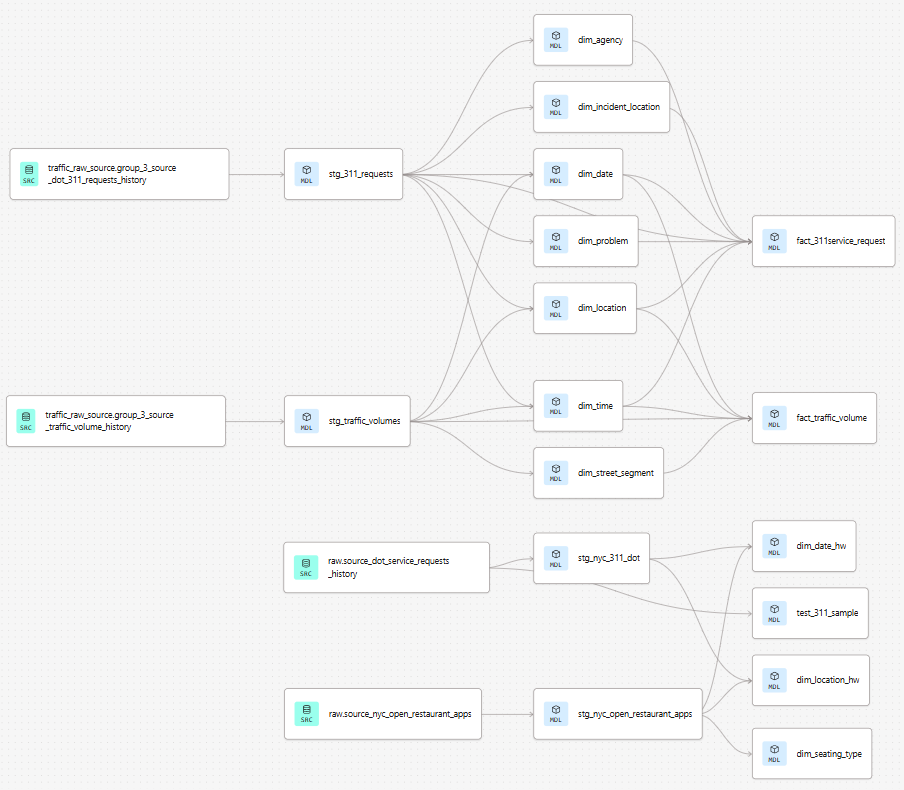
Staging Layer
Staging models perform light transformation on the raw tables: renaming columns to consistent snake_case, casting types, and filtering out clearly invalid records (e.g., closed dates earlier than created dates).
Key staging transformations for stg_311_service_requests:
- Parsed
created_date,closed_date,due_dateasDATEtypes (source is string) - Extracted
year,month,dayto support date dimension surrogate key generation - Filtered complaint types to the five street-related categories
- Standardized borough names to title case
Key staging transformations for stg_traffic_volume_counts:
- Parsed
datecolumn asDATE - Extracted
hourandminutefrom the timestamp string - Mapped
segmentidto the street segment dimension - Filtered to records within 2020–2025
Mart Layer
The mart layer implements the full star-schema dimensional model. dbt models create each dimension table first (using { generate_surrogate_key() } for surrogate keys), then the fact tables that reference them.
| dbt Model | Target Table | Type |
|---|---|---|
dim_date |
group_3_marts.dim_date |
Dimension |
dim_time |
group_3_marts.dim_time |
Dimension |
dim_location |
group_3_marts.dim_location |
Dimension (conformed) |
dim_problem |
group_3_marts.dim_problem |
Dimension |
dim_agency |
group_3_marts.dim_agency |
Dimension |
dim_incident_location |
group_3_marts.dim_incident_location |
Dimension |
dim_street_segment |
group_3_marts.dim_street_segment |
Dimension |
fact_311service_request |
group_3_marts.fact_311service_request |
Fact |
fact_traffic_volume |
group_3_marts.fact_traffic_volume |
Fact |
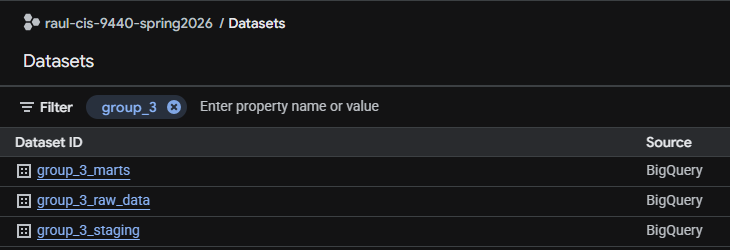
BigQuery Datasets → Final State
dbt Project Config
The dbt_project.yml and packages.yml are in the repository root. The project uses the generate_schema_name macro to keep dataset names consistent across environments.
Reproducibility
To reproduce the full pipeline from scratch:
- Clone the GitHub repository
- Set up a BigQuery project and configure
profiles.ymlwith your credentials - Run the Cloud Function (or equivalent) to load raw data
- From the repo root:
dbt deps && dbt run && dbt test - Run the Milestone 5 SQL queries (
queries/milestone5_queries.sql) in BigQuery to create the analytics mart tables used by Looker Studio